Category Archives: Education and Training

Education and Training information is for folks looking for help to earn or upgrade their license, learn about Amateur Radio, and get help with Ham Radio questions.

Propagation Prediction Websites

Is the 20-meter band open to the location of the latest DXpedition on the bands?   When is 6 meters open for Sporadic E?  Looking for a weak signal 2-meter contact with a specific grid square?  There are websites you can visit that give you a prediction of whether the band you are on is open to a given destination.

HF Propagation

N0NBH Propagation Widget

The simplest HF propagation prediction is the widget that is seen on many Amateur Radio Websites – QRZ.com, DXSummit.fi, and more.   This gives you a rough idea of what bands are open day and night. Data is based on the Sunspot Number, A and K indices, and other indices.  But this doesn’t take into account many factors like your location, the DX location, the characteristics of your station, and the DX station.  Just because 15m says Poor doesn’t mean you won’t hear anything on the band.

VOACAP – HF Propagation Prediction

VOACAP Point to Point Prediction

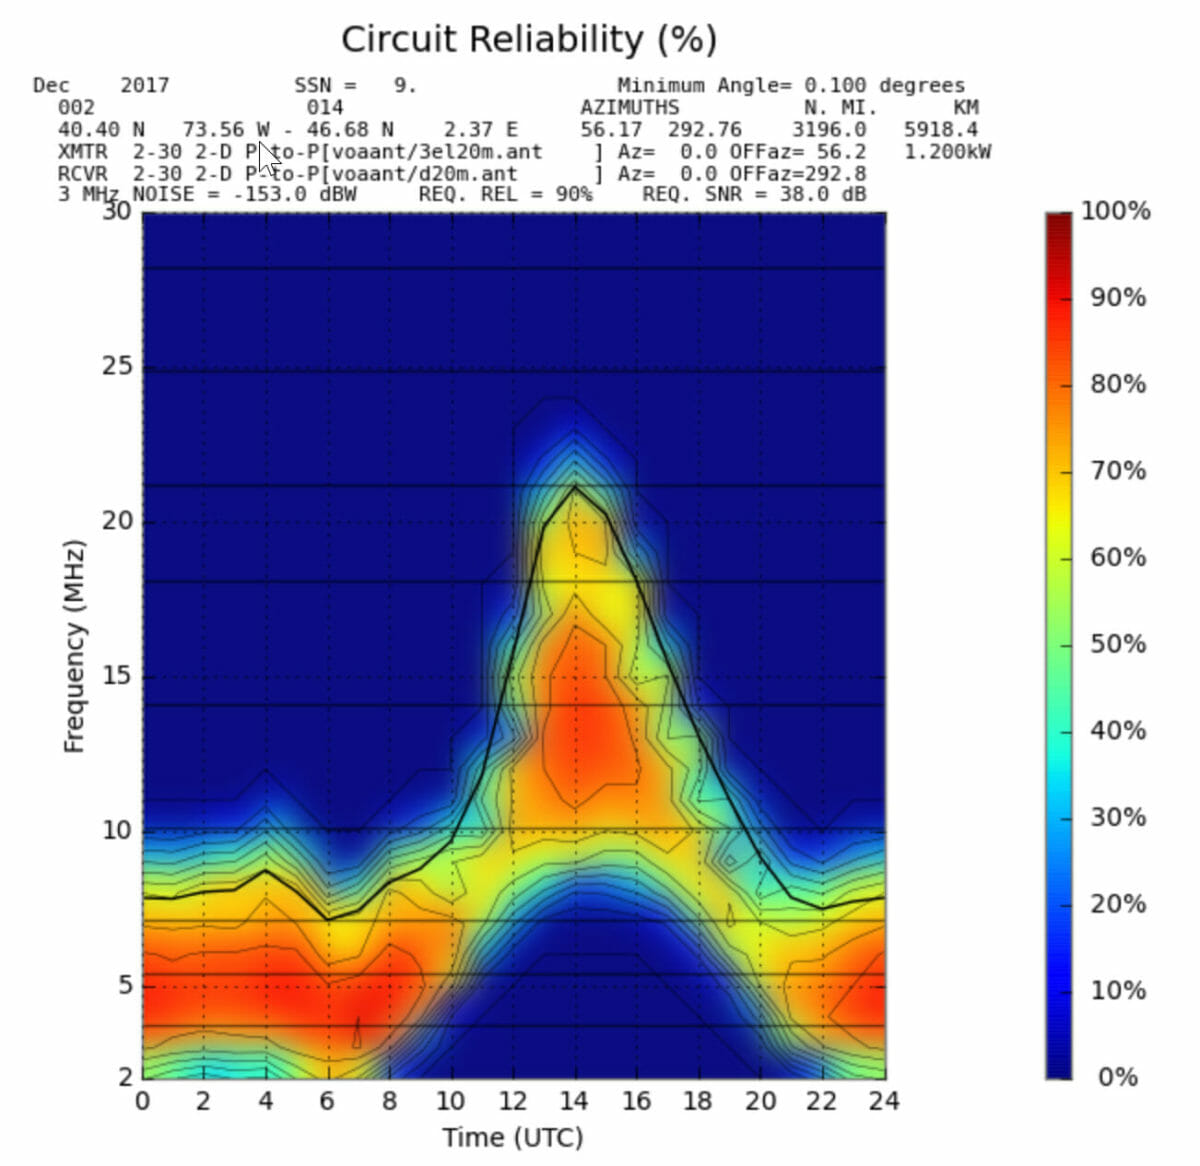
VOACAP is the Voice of America Coverage Analysis Program and provides detailed information about HF propagation.  You can choose transmitter and receiver locations from many cities around the world.  It also provides choices of Antennas, Power, Mode, and more for each end of the contact. You can look at several different views of propagation.  If you spend some time delving into the details of propagation visit this site.

VOACAP prediction from DXSummit.fi

For a faster view of whether you will be able to contact a specific DX Station that is currently on the air,  the DXSummit.fi spotting website has incorporated propagation predictions on their website.  If you find a DX station spotted there that you contact, just right-click on the DX callsign and select VOACAP from the drop-down.   You just need to choose whether you are a Basic (100 watts and a Wire) or a Superstation (Amplifier and Directional Antenna).  You can also look at views of Short Path or Long Path.  It will give you a good view of when you need to be on which band to contact the DX station.

6 Meters – The Magic Band

DXMaps - 6 Meter Openings
DXMaps – 6 Meter Openings

The best website that I have found for 6 meters is DXMaps.com.  It provides a map view of the world or you can select a continent. Based on spotting network data, it shows 6-meter contacts and color codes them by Sporadic-E, Multihop ES, Meteor Scatter, etc…  even Aurora.  You can also get a view of 10 meters, 2 meters, or 70 cm.  If you sign up for a free account, you can subscribe to real-time notifications when there is an opening near you.

2 Meter Propagation

VHF Propagation Map
VHF Propagation Map

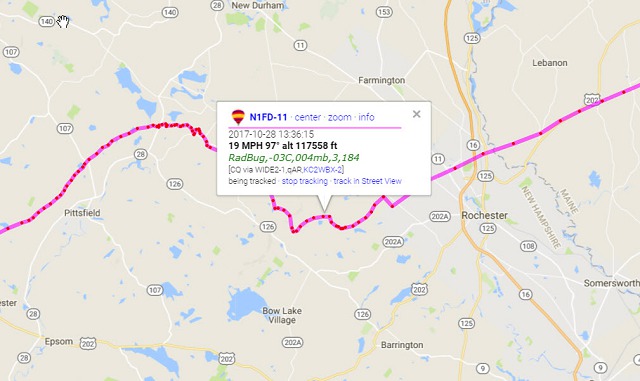
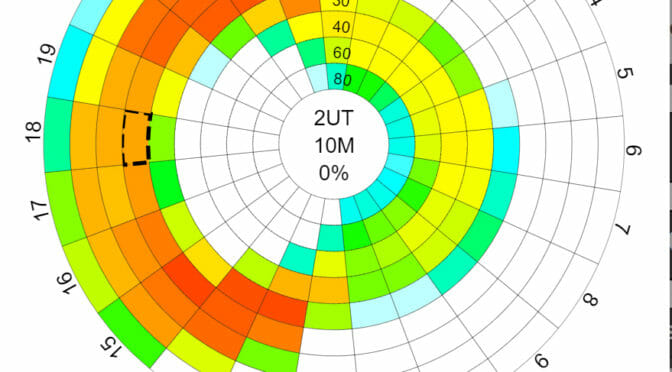
Looking for a tropo opening for a weak signal 2-meter contact?   Visit the website http://aprs.mountainlake.k12.mn.us/ to see a VHF Propagation map.  This shows tropo openings as color-coded clouds – with brighter colors for the longer openings.    This is based on APRS data.

These are the websites that I like to visit to understand the propagation forecast for the day.  If your favorite site is not on the list, add a comment so the rest of our readers can check it out.

Anita, AB1QB

Students Analyze HAB-2’s Flight Data

The HAB team members in NARS have created a five-session curriculum to teach physics, atmospheric science, and radio technology that we use as part of our HAB launches. The last session is the most fun of all – analyzing the telemetry data from our HAB’s flight to see what the students can learn from it.

High-ALtitude Balloon Data Analysis
HAB-2 Flight Data Analysis

Our students at Bishop-Guertin High School that participated in our High-Altitude Balloon 2  launch this past weekend got together to analyze HAB-2’s flight data.  All of our students tracked HAB-2 using APRS.fi and were excited about the HAB’s flight and final altitude of almost 118,000 ft!

Flight Path

We began by reviewing our flight predictions and expectations for atmospheric conditions that we covered in our previous classroom sessions. You can see the materials that the students worked from via the preceding link. Also, the full set of data from HAB-2’s flight computer can be viewed as well.

HAB-2 Predicted Flight Path

We began by comparing the predicted flight path with the actual data from the APRS system on HAB-2.

HAB-2 Actual Flight Path

The students concluded that the shape and direction of the predicted and actual paths matched quite well giving us confidence in the path modeling software.

Balloon Performance

Balloon Performance Calculator

They also noted the HAB-2’s ascent took longer and went much higher than the Balloon Calculator we had used predicted. After some thought, one of the students observed: “maybe we did not put enough helium in the balloon”.  This tuned out to be correct. We checked the scale that we used to set HAB-2’s lift with calibrated weights and we found an error in the scale’s calibration that led us to put about 200 g less lift (less Helium) in the balloon than our model required. We also used the same scale to weight the flight platform. These errors would certainly account for the higher altitude and long ascent times that we experienced.

Temperature and Pressure

High-Altitude Balloon Data Aalysis
GoPro Camera Early Shutoff vs. Temperature (click to enlarge)

The students also looked at the pressure and temperature data from the flight. The pressure was about what was expected but the students noticed that HAB-2 had flown through some temperatures as low as -70° F! The discussion turned to the question of why our video cameras had stopped recording at almost exactly the same time – 53 mins into the flight. An examination of our temperature data gave as a probable answer: the temperature took a dip to -50°F about the time that the GoPro video cameras shut off! Their LiPo batteries are only rated to about -40°F. We concluded that we’d need to find a way to keep the camera batteries warm during our next flight.

Other Questions

High-Altitude Balloon Data Analysis
High-Altitude Balloon Data Analysis Questions

The students discussed some additional questions and previewed some raw video from the flight and the recovery included a flight path simulation created by Wayne, AG1A.

HAB-2 Open House

Amatuer Radio Open House
Amateur Radio Open House

We are planning an open house for the students at our QTH to wrap up the project and to preview the final light video. Members of NARS are welcome to join us for the open house. You can find more information about it here.

I especially want to thank all of the NARS members who worked to prepare for and assist the students with HAB-2:

Without our HAB team, HAB-2 and the STEM learning experience that it provided would not have been possible. Thank you all for helping us to create a positive STEM learning experience through Amateur Radio.

Fred, AB1OC

HAB-2 Sets Altitude Record!

We flew our High-Altitude Balloon for the second time this past weekend. Our second High-Altitude Balloon Flight (HAB-2) was part of a STEM learning project that we did with STEM club students at Bishop-Guertin High School in Nashua, NH. The students did all of the flight prep and launched HAB-2 at approximately 11 am ET from a school in Winchester, NH. Parents, teachers and local students joined us for the launch as did several members of our HAB team.

High-Altitude Balloon 2 Actual Flight Path

Our students and many Hams were able to track HAB-2 during its flight via APRS. HAB-2’s actual flight path prediction matched our modeling quite well.

High-Altitude Balloon 2 Predicted Flight Path

The direction and shape of the path were almost the same as what our model predicted but the flight took longer and went higher than we expected.

High-Altitude Balloon Altitude Record
High-Altitude Balloon 2’s Balloon Burst Altitude

We broke our previous altitude record by A LOT! The balloon burst west of Rochester, NH at just short of 118,000 ft! HAB-2’s final altitude was about 400 ft higher than the last APRS burst shown above. This is more the 25,000 ft higher than our last flight!

HAB-2 Water Landing in Maine

HAB-2 landed in a pond in Maine. Our floatation system worked well – it kept most of the electronics dry and prevented HAB-2 from sinking.

HAB-2's Water Recovery in Maine
HAB-2’s Water Recovery in Maine

Fortunately, Jamey, KC1ENX and Curtis, N1CMD had Jamey’s kayak and were able to retrieve HAB-2. The equipment was wet but appears to be in good working condition. We have all of the telemetry data from HAB-2’s flight.

Due to a glitch at launch, the platform flew on its side for the entire flight and the cameras shut off early due to some unusually cold conditions (-70° F) that HAB-2 encountered during its flight. We did get some video from the first 50 minutes of the flight.

You can view the video of HAB-2’s launch, flight, and recovery below.

Our students will be getting together later this week to analyze the data from HAB-2’s flight. We are also planning an Amateur Radio open house for them on Sunday, Nov. 12th at our QTH.

Congratulations to our students and to our HAB Team for another successful flight!

 Fred, AB1OC

Radio Amateurs Developing Skills Worldwide