— Robert Burns, On Turning up in Her Nest with the Plough, November 1785
Though we had some last minute speaker changes last winter, we had great presentations every night. Here are the planned meeting topics for the next six months.
May 1, 2018
MIT Haystack Observatory talk
Phil Erickson, W1PJE
May 8, 2018, Tech Night
Show and Tell: Hilltopping/portable gear
All
June 5, 2018
Field Day Planning Meeting
Field Day leadership
June 12, 2018, Tech Night
Field Day Skill Builder (Towers, Cables, Filters, etc.)
Field Day leadership
FIELD DAY
July 3, 2018
Field Day retrospective
Field Day leadership
July 9, 2018,
Tech Night
Raspberry Pi and Ham Radio
Anita / Jamey, AB1QB / KC1ENX
August 7, 2018
No meeting
August 14, 2018,
Tech Night
Foxhunting antenna build and strategy
Jamey Finchum, KC1ENX
September 4, 2018
BitX40
Andy Stewart, KB1OIQ
September 11, 2018, Tech Night
DMR Radios and Programming
Bill Barber, NE1B
October 2, 2018
ISS contacts, satellite contacts, etc.
Fred / Anita, AB1OC / AB1QB
October 9, 2018, Tech Night
Frequency measurement challenge ideas and strategies
George Allison, K1IG
Everyone should consider the above to be tentative, as speakers occasionally need to cancel or reschedule. That said, we have a few excellent speakers who have offered to step in should we have a last-minute cancellation.
If you have interest in presenting something at a regular meeting or a tech night, please drop me an email. It doesn’t need to be highly technical. It doesn’t need to be an hour long. It just needs to be fun!
Look for a new page with meeting plans on the n1fd.org website soon.
The March Tech Night (March 13, 2018) will have an introduction to antenna modeling by me, Scott, NE1RD. I’ll begin by going through some antenna theory and then proceed on to the NEC-2 software and its popular front ends EZNEC and CocoaNEC. (Both the evaluation/demo version of EZNEC, and the Macintosh-based CocoaNEC are free.) LINUX users should consider getting Andy (KB1OIQ) Stewart’s Andy’s Ham Radio Linux suite. The main concepts you’ll learn will apply equally well to any of these programs.
Please download the antenna modeling software for your platform, and download the slides for this presentation from the Tech Night web page. The slides have a lot of detail on them, and it will be much easier to see the subtleties on your own screen.
So, bring your laptop with software and slides, and we’ll have you modeling antennas by the end of the evening. See you there!
Recently, it’s been difficult for me to find a solid block of time to go down to the shack and operate. I’ve been looking for other things to do, therefore, to stay relevant in the hobby and always keep my learning vectored forward. Since I have an interest in one day building my own satellite station, and I receive the ARRL Keplerian Data emails via AMSAT (which show the latest Two-Line Element (TLE) sets of all the amateur sats), I thought it would be pretty neat as a first step to use Python and code up a predictive tool to plot the and track the location of all the amateur satellites will be given a UTC start and end time.
There are packages which already do this (much better than my own) such as MacDoppler. The perks are it shows coverage (footprints), orbital tracks, and even compensates your radio’s VFO for the satellite’s Doppler. The downside of this package is it costs money ($98 for a license), and it doesn’t make sense for me to pay for it when I don’t have a satellite station to utilize it. The rest of the functionality, though, I could figure out myself if I have enough time to code. And coding, is something I can very easily do on the couch in between changing dirty diapers. 🙂
There are a fair number of dependencies to this codebase which uses Python 2.7. Installed, you must have:
Numpy/Scipy: basic and advanced mathematical functionality
urllib2: Opens the websites needed to HTML scrape the satellite TLE’s
Basemap: This actually plots the map of the world with the satellites across it
Tkinter: Creates the GUI windows to ingest data from the user
pytz: A package to get local time at your QTH (may already be installed with most distributions)
Pyephem: used for validation of my own answers. Really nice library though to do all things astronomical
If you don’t have Python already installed, I recommend using the Anaconda distribution, especially if you don’t have root access on your machine for whatever reason. This is a self-contained Python environment and it is just like installing everything in your /usr/local account.
Once you have Python and all the dependencies successfully installed, you can obtain the code from the link to the GitHub repo.
Basic Operation
The steps to using the software are relatively simple. The user first runs the main executable at a terminal prompt:
python main.py
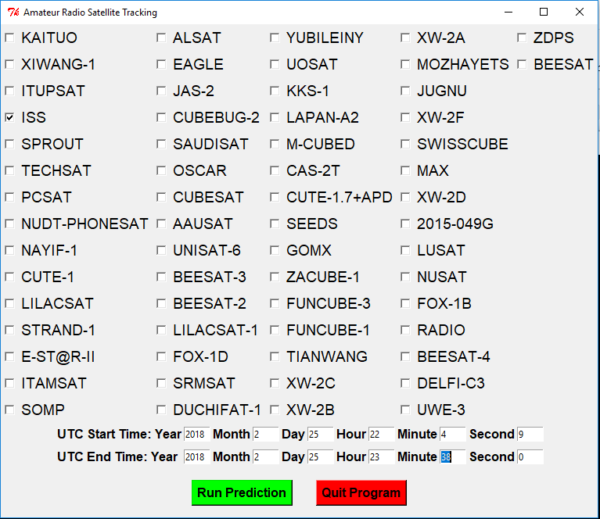
From there a GUI window pops up displaying checkboxes next to all the satellites, two entry fields for a start and end UTC time (in 24 hour format), and a Run/Quit button.
The main GUI window for the code. The checkboxes appear next to satellites. The UTC start/end times are entry boxes to the user. REMEMBER TO USE 24 HOUR FORMAT!
Once the Run button is pressed, a map will pop up displaying the satellite track across the Earth for the chosen times. Currently, I would only recommend only plotting 1-2 satellites at a time since the map can become quite cluttered with tracks. Also, I would make the stop time only a few hours different from the start time since many of the satellites will have already executed a complete orbit in that timeframe.
Example output map and track of the ISS
Under the hood
First the software opens the URL of where the latest and greatest satellite TLEs are stored and scrapes them for all the user choices. Next, if the user chooses a UTC time before the most current TLE, the program defaults to using the epoch UTC from the TLE. As for the end date, I wouldn’t go any further than a few days out if you want the results to be fairly accurate.
Once the data has been gathered, internal routines convert the information in the TLE into the needed orbital or Keplerian elements to find the orbital path. Those Keplerian elements then undergo further processing to two different reference frames until finally the latitude and longitude can be extracted. I’d be happy to go into significant detail on what these algorithms are, but I’m pretty sure you probably don’t care! 🙂 Besides, you could easily check out the source code.
To-Do
I do plan on updating this a bit, so be sure to pull down new updates from the repo often. But, I’m actually really looking for feedback from one or two people to tell me what functionality they would like to see. For now, however, what I have planned is:
Display satellite footprints to better see when the satellite is up relative to the QTH
Have the map run in real time thereby eliminating the entered start/stop time
Compute satellite Doppler offsets
Have a function to show which satellites will be up relative to your QTH within a given 48 hour period
Validate results beyond a few sample cases involving the ISS
So there you have it! Hopefully if I get the above to-do incorporated into the code as well as comms with the rig (to update VFO based on Doppler, for instance), then I should be able to mimic the MacDoppler capability by only paying the price of time. I’d really like this to be an open-source substitute for that software. There’s still much to be done for this to be a really useful tool, but it’s coming along. Also please alert me to any bugs found. I know there are a ton probably. Happy tracking!