What is HFTA
HFTA stands for High-Frequency Terrain Assessment. Some documentation refers to it as High-Frequency Terrain Analysis.
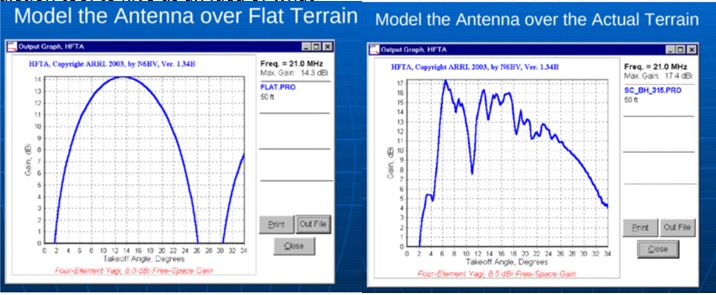
HFTA is a software tool that generates the vertical radiation pattern of horizontally polarized antennas taking into account the profile of the surrounding terrain. The irregularity of local terrain has a profound effect on vertical radiation patterns. Note that HFTA does not compute radiation patterns for vertically polarized antenna radiation.
Azimuthal Maps
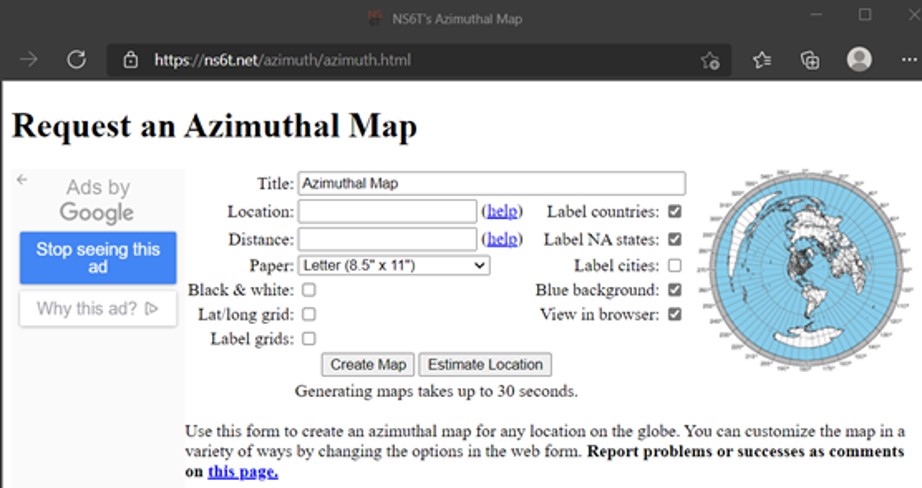
HFTA provides performance information for your antenna taking account of the terrain profile in a particular direction. Do you know what is out there in any direction? Standard Mercator maps show a representation of the world, but do not provide important information that is of use to Hams. There is a website that will create a map with your location at the center of it. It is free and all you need to know to use it is your grid square info. The more info you have the more accurate the map is.
Check out https://ns6t.net/azimuth/azimuth.html

Above is a map for Tewksbury, MA
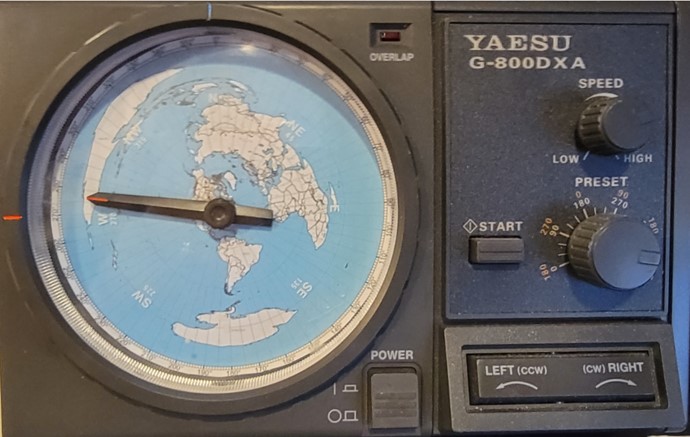
You can put the map on your rotator controller to show where it is pointing. Some computer-based rotator control programs can also use the image.
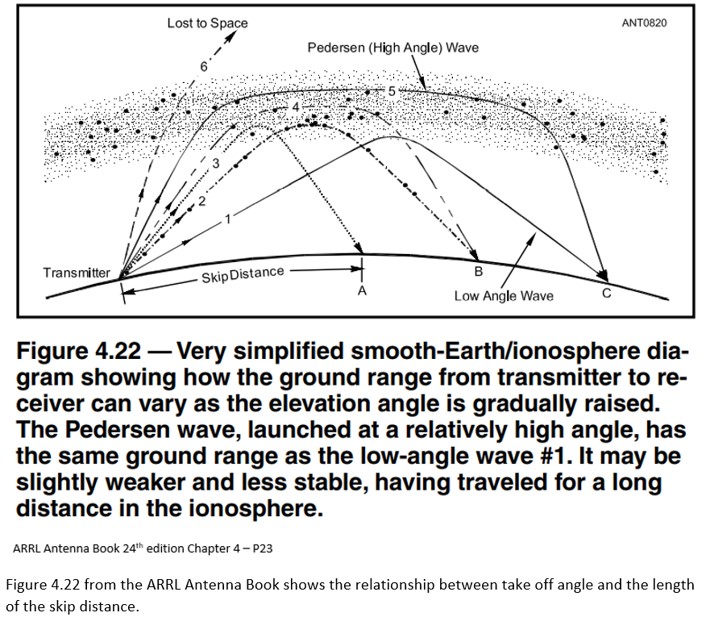
Take-off Angles
Why use HFTA
Use HFTA for planning an HF station scientifically. It can assist with determining the optimal antenna location and height. HFTA takes ground elevation data, frequency, and the height of the antenna to calculate the take-off angle in a specified direction. It is particularly useful for Hams interested in DX and contesting. Many of us use some type of propagation prediction tool to give us an idea of what bands may be open at a given time and to a specific location. Once the terrain profile and antenna information are configured the results can be used to provide a tool for propagation prediction that is custom tailored to your precise situation. This is very helpful when formulating strategies for contesting or hunting down rare DX. Terrain around your antenna up to 10,000 feet has a significant impact on your signal.
Typical questions that HFTA can answer
- How high should my antenna be?
- Is it worth spending more money on a taller tower?
- My mast is up 35 feet. Is it worth it to extend it to 45 feet?
- Why can’t my antenna hear signals from ??
- About to by a new house? Is the house location well suited for Ham Radio?
How does it work
1. Generate terrain profile data files. These are created using digital terrain data available from various online databases. There are a few additional programs that can be used to create these files and the HFTA instructions cover the required steps in detail.
2. Choose the type of antenna and the number and heights of antennas in a stack.
3. Select the type of antenna to be used.
4. Select an Elevation-Statistics file for your targeted receiving area. This file will include your station location (receiving area) and the area from which you will be receiving signals.
The software includes files with statistics that were computed for all the times over the 11-year solar cycle when each band was open. The Antenna Book’s data contains files for all regions of the USA to Europe (EU), the Far East (JA), South America (SA), South Asia (AS), Southern Africa (AF), and the South Pacific (OC), plus data files for a wide variety of other transmitting sites throughout the world. You choose the general area where your transmitter is located during initial installation of the HFTA program.
How to get HFTA
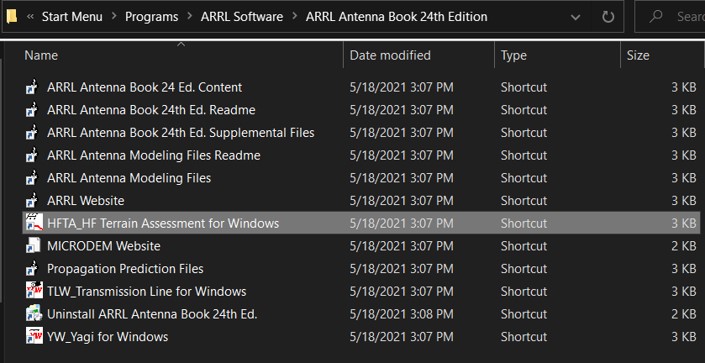
HFTA is included in the ARRL Antenna Book (currently 24th Edition). It is part of the package that includes the book when you get it for download from the ARRL. It was also included in a CD that came with the physical book. The e-book or Kindle is available from different sources. To be sure you get the software files associated with the book I suggest ordering it directly from the ARRL. Here is a link: http://www.arrl.org/shop/ARRL-Antenna-Book-eBook-Windows-Version/
K6TU.NET

The website https://www.k6tu.net/ is an excellent resource in combination with the HFTA software and offers many tools and resources beyond those that support HFTA.
Users need to register for free to use the tools and there is also a subscription service which offers more tools that go beyond the scope of HFTA available. To create HFTA Terrain Profiles, this website makes it very easy and offers very accurate data for stations located in the USA.
K6TU.NET provides a framework of simple to use forms to build propagation predictions or Terrain profile requests. Use the Resource menu at the top of the page to access guides, FAQs and background information. Use the Getting Started page to start with a tutorial which will guide you through the steps to create your first prediction.
Generating an accurate terrain profile
K6TU.NET now has the capability to generate a set of profile files for your location by simply filling in a form and submitting the request. Much like generating a Propagation Prediction, the site captures the information necessary to fulfill the request and then generates the results in the background. Once the results are available, an email is sent to you with a link to the results.
Generating a Terrain Profile Request is very simple and starts by selecting Terrain Profile from the New menu at the top of the page when you are logged in as a registered user. You do NOT need to be a subscriber to K6TU.NET to access this service – it is freely available to anyone with an activated account.
When the request is completed, the site creates a Terrain Profile Result which has a link to the ZIP file containing the terrain profile files (360 of them, one for each degree of azimuth) together with an explanation of the source of the terrain data for this profile.
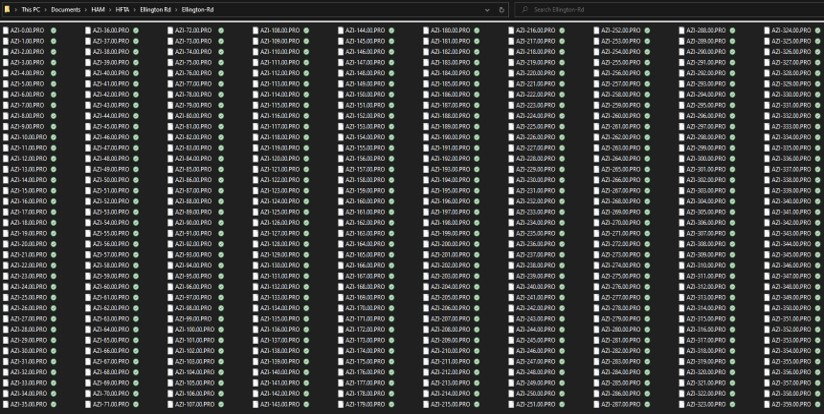
The screenshot above shows the 360 files for the terrain data for my QTH in Tewksbury, MA I have another folder with the terrain data for my NH QTH as well.
HFTASweep
HFTASweep is a program “wrapper” for the ARRL HF Terrain Analysis program (HFTA). HFTASweep runs HFTA 90 times programmatically to model your HORIZONTAL polarized antenna over the actual terrain around your location. The program captures the results for each azimuth direction (4 different azimuth angles at a time) and at the end, builds a VOACAP type 13 antenna model as a file called antenna.13. You can upload type 13 antenna files to K6TU.NET and use them in the different prediction options by creating an Advanced Station Configuration from the New option under the Navigation menu. Once you have the type 13 antenna file you can use it to create custom tailored propagation forecasts. Here are a few examples:
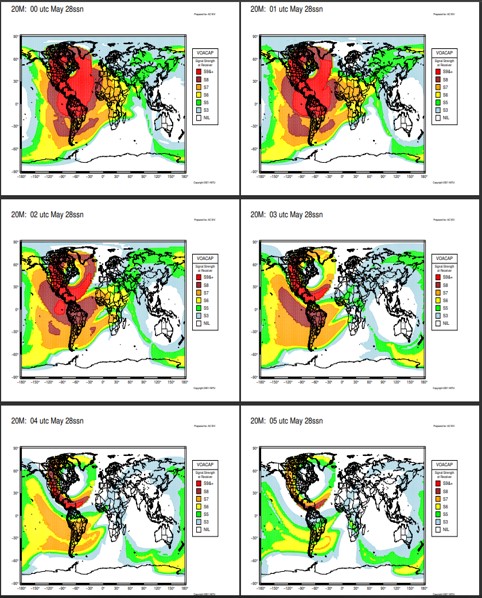
This is 20 meters in May. There is one chart per hour.
Custom Tailored Propagation Forecasts
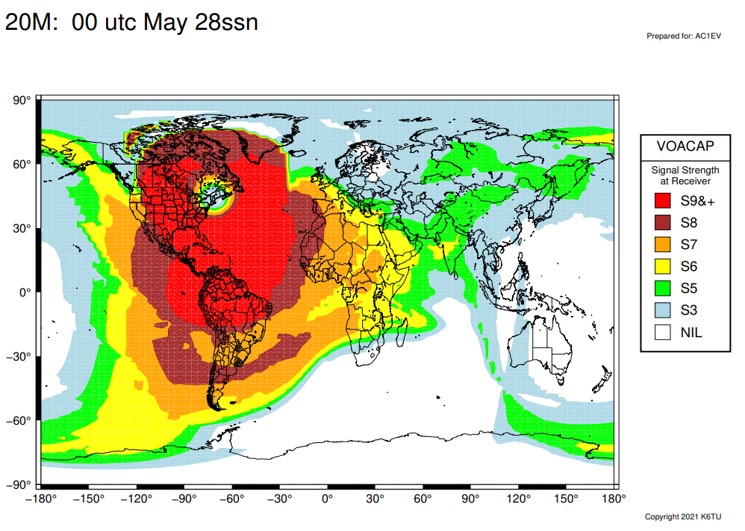
Here is a close-up of one hour on 20 meters.
Contest Strategy
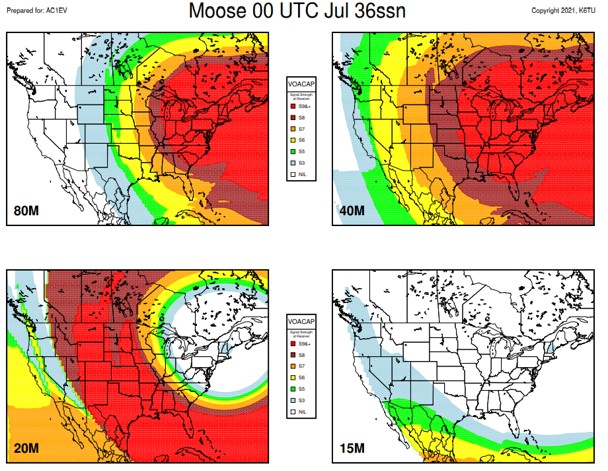
Another feature is to prepare multiple band reports to use for formulating contest strategy. Here is an example I created for my NH QTH for 13 Colonies back in July. There are very good instructions and examples on the K6TU web site. It is worth checking out.
How to use HFTA
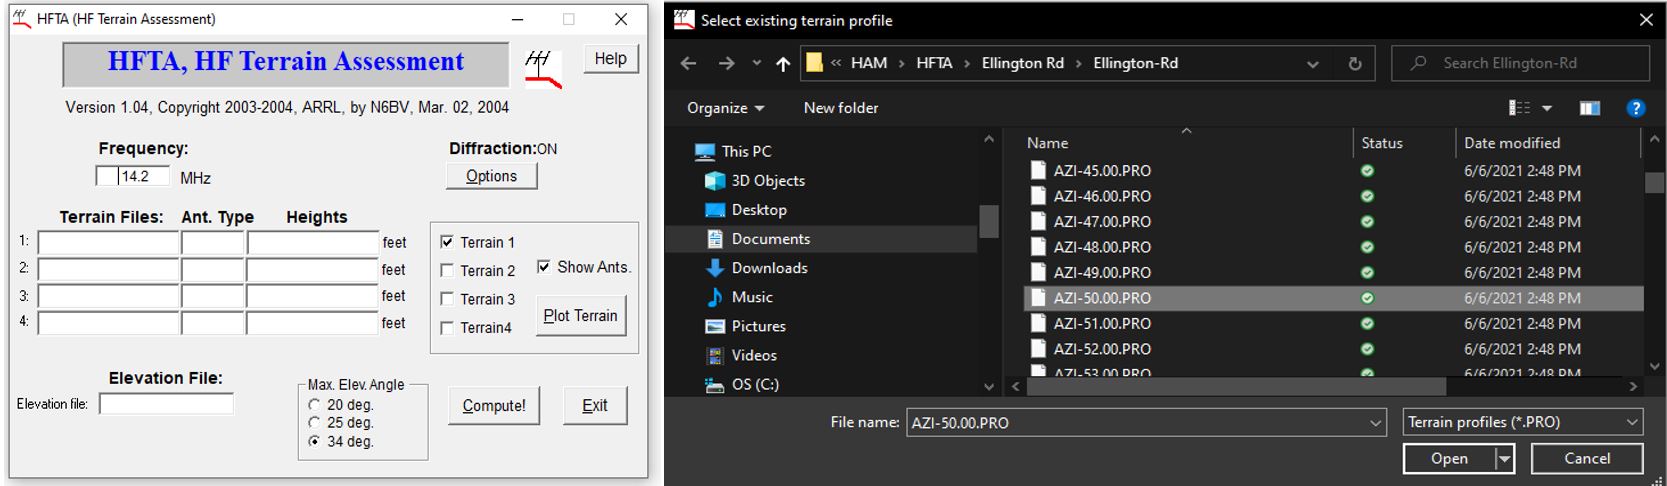
1. Launch the program
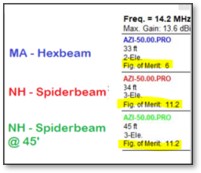
2. Select the terrain files you will use for this assessment by clicking in the box. In this example we will examine performance for 50 degrees, which is towards Europe. This Terrain File is for my MA QTH
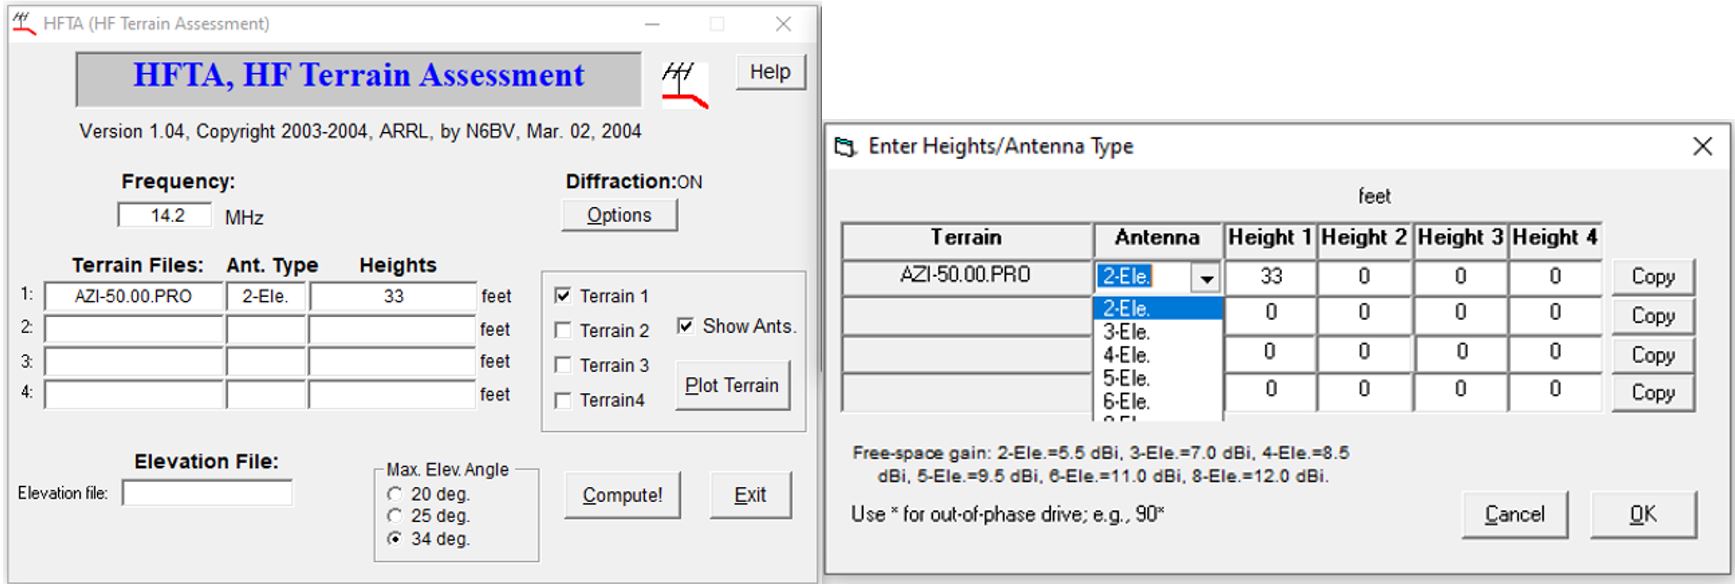
3. Click in the Ant. Type box to select the antenna type from a pull-down list. Enter the antenna height in the appropriate box. You can stack antennas up to 4 high!
4. Repeat for other antennas, locations, and heights you wish to compare. In this example I will add a 3 element yagi at 34 feet at my NH QTH (just select the Terrain Profile from that location) and a 3 element yagi at 45 feet from the NH QTH.

5. Enter the Frequency
6. Select an Elevation file. These are included with the HFTA software. They are the files derived from the 11-year statistical data mentioned above. This example is for Boston to Europe.
7. Check off the boxes for terrain for each antenna selected and HFTA will generate a profile for that compass heading.
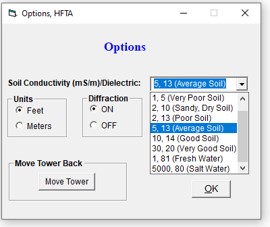
8. The Options button lets you configure units of measurement, Diffraction on/off, and Soil Conductivity (among other things). I have Diffraction turned on since I am around 3 miles from a ridge that is around 200 feet above my antenna. The chart makes it look like I am pointing into the hill, but it actually calculates out to be only 0.76 degrees up from my antenna. I believe my soil in NH is “Good Soil” but I selected Average Soil to create a conservative assessment.
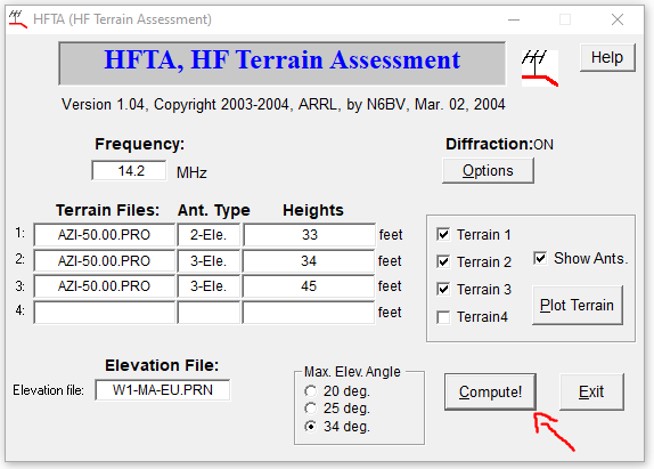
9. Click the Compute button to generate the chart.
My Results with HFTA
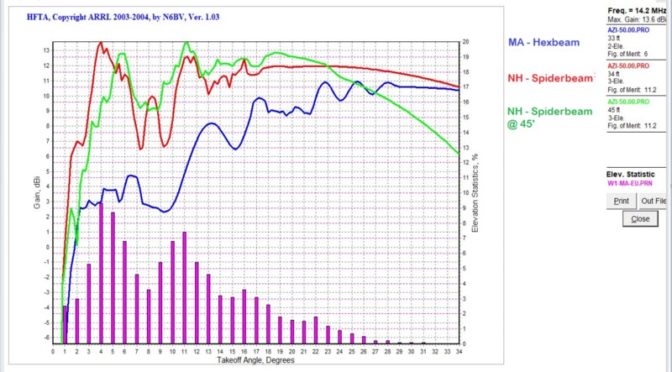
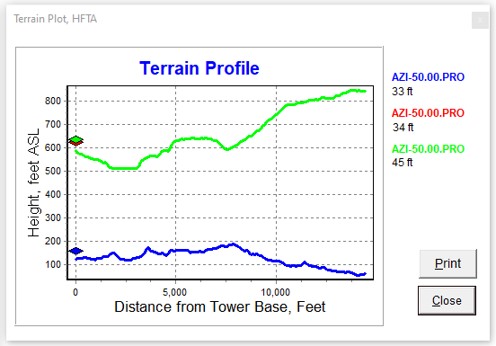
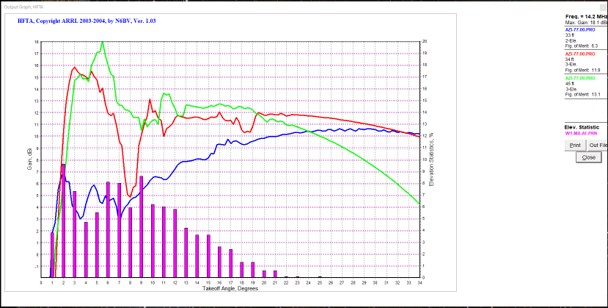
The Output Graph can be resized. Here are my results for the three antenna configurations pointing to Europe:
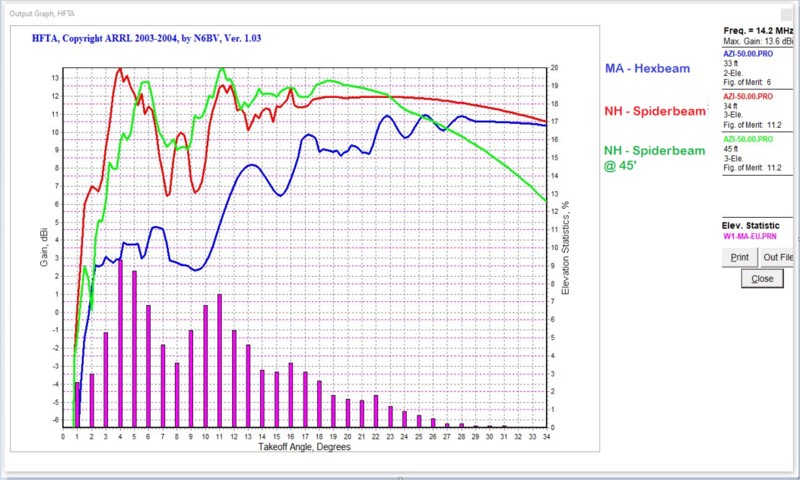
The Purple bars show the take-off angle plotted against the percent of time that signals arrive at that angle. This data is what is in the .prn files that you enter in the Elevation File field. Each antenna profile’s performance is represented by the colored line on the chart.
There are some very interesting things that show up on this chart:
1. The Spiderbeam at 33 feet has better performance at low angles than at 45 feet. Also, where the higher configuration is better, it is not a meaningful difference.
2. Both the Spiderbeam and the Hexbeam are adequate for coverage to Europe.
3. At this azimuth (50 deg) for some take-off angles the Spiderbeam has more than a 10 dBi advantage over the Hexbeam! This is before any radio or amp is added to the calculation.
Figure of Merit
HFTA uses these elevation statistics, which indicate what percent of the time a signal arrives at a given elevation angle, and compares this info to your elevation plot, generating a relative performance rating called Figure of Merit, expressed in dB.
The software produces a “figure of merit” which is each antenna’s merit based on gain at takeoff angles where, statistically, the most prevalent signals can be expected. If you have great gain at takeoff angles where most of the time no signals are arriving, the FOM is low. When comparing different antenna configurations, the FOM can be used to identify which has an advantage. For the Spiderbeam used in my Europe example, the FOM is the same for 33 feet and 45 feet. The effort and risk to elevate the antenna does not appear worthwhile in this case.
Real World Example
Recently, I noticed a station from Kenya spotted on the cluster. I took a few minutes and was able to make a call successfully to 5Z4BU. I don’t often hear Kenya on the radio, so I ran an assessment using 77 degrees and the Africa Elevation file. Here are the results:
In this case the Spiderbeam at 45 feet would have an advantage, but the antenna at 33 feet was still capable of receiving signals from any likely take-off angles. The FOM for the 45-foot antenna was 1.2 higher than the 33-foot antenna. The Hexbeam in MA may have been able to make the call, but there was a pileup and the additional gain from the Spiderbeam really helped. I was able to make contact in 4 tries.
Australia and New Zealand
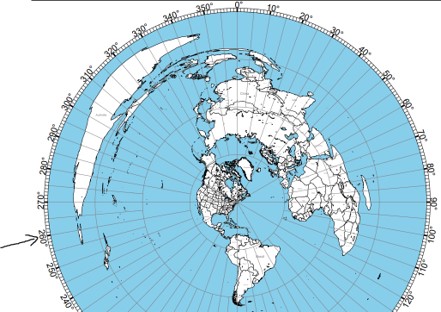
Here are two more examples to review. First, we’ll look at Australia and New Zealand. I’ll point my antenna at 260 degrees, which splits the difference between them.
Here is the terrain profile compared with the path covered on the map.
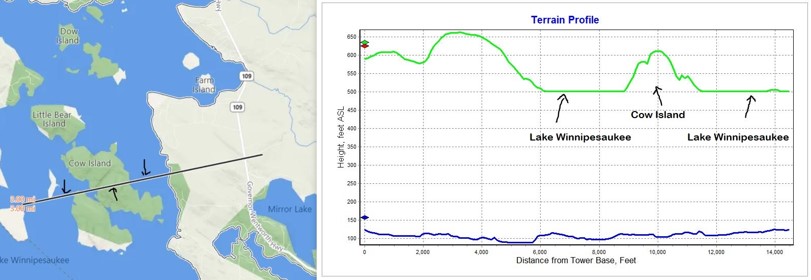
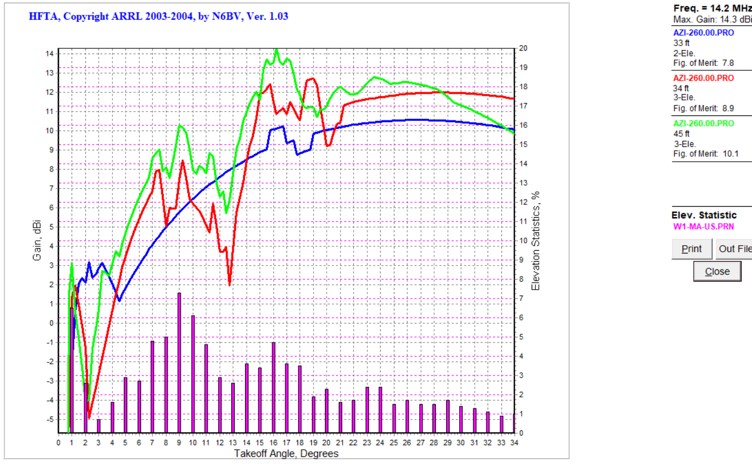
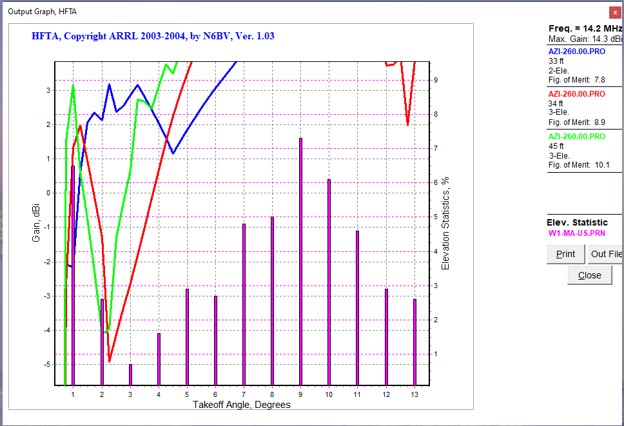
The chart above shows that although New Zealand is around 9,000 miles away, it is not difficult to make contacts there as there are many take off angles that can give successful results. You can select in the chart to capture a close-up of details.
The chart shows that the Spiderbeam at 45 feet will receive signals well at 1 degree and it looks like it will also at the 34-foot height. The Hexbeam will likely miss signals at 1 degree but should handle 2 degrees fine. New Zealand was one of my first Pacific DX QSOs and done with an OCFD and 100 watts.
Japan
Next, we can check out Japan, which is at 335 degrees. We’ll review the steps again:
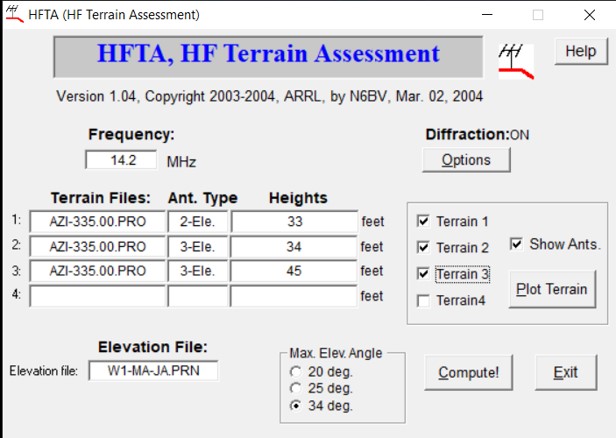
1.Select the Terrain files from each location for 335 degrees
2.Confirm Antenna type and heights are set properly.
3.Select the Elevation file
4.Click Compute!
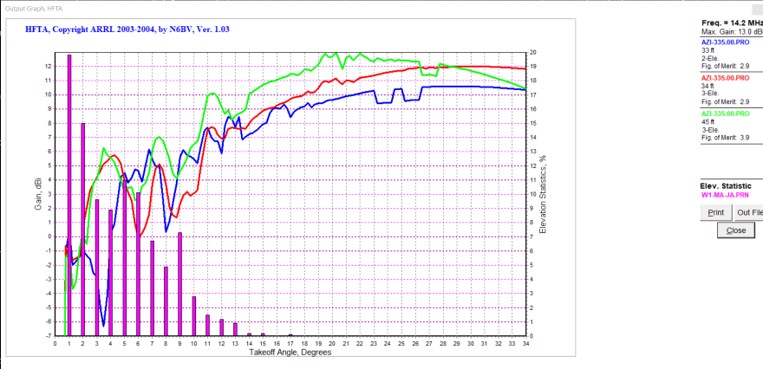
This chart has lots of useful information. Unfortunately, it does not indicate that I will have a high probability of success contacting Japan. According to the chart, 20% of signals from Japan will come in around 1 degree and 15% at 2 degrees. Both antennas will fail at this angle. The Spiderbeam will have success from 3 degrees and higher. It is interesting to note that the Hexbeam will perform better at 6-degree take-off angle. Japan is only 6,700 miles away, but you can see it is way more difficult to reach than New Zealand.
Conclusion
- This has been a simple introduction to HFTA. There are many documents and videos available that discuss the features of the program and strategies for using it.
- How well an antenna “plays” depends on take-off angle to the target area, antenna height and local terrain
- Lower is sometimes better.
- More than one antenna per band will help your overall signal presence.
- Design your antenna farm to cover all angles. If you can’t, choose what is important to you.
- It is easier to make changes in the design stage of your antenna project. Time spent with this assessment tool can save big dollars and yield a better installation than trial and error.
- The ARRL Antenna Book is a terrific resource. This presentation was based on only a tiny fraction of what the book covers. It makes a great gift, too!
Helpful Links
The ARRL Antenna Book for Radio Communications 24th Edition https://www.arrl.org/arrl-antenna-book
K6TU.NET | Propagation as a service
Practical Notes on Terrain Assessment (What I Have Learned in the Last Dozen Years) (seapac.org)
take-off angles Archives – KB6NU’s Ham Radio Blog
HFTA and your station (qsl.net) – great presentation info
December 08, 1997 by N6BV (arrl.org) – instructions
Takeoff Angles & HF Terrain Analysis (HFTA) — Presented by Kevan Nason N4XL – YouTube
Jon, AC1EV